Importance of Tourism in Nepal
Tourism is one of Nepal’s most vital economic sectors, contributing significantly to foreign exchange earnings, employment generation, and regional development. It supports thousands of enterprises — from trekking agencies and hotels to airlines and local handicraft industries. According to the Nepal Rastra Bank (NRB), tourism accounts for around 7–8% of the national GDP and remains a key driver for infrastructure growth in remote mountain regions.
Beyond economics, tourism in Nepal plays a crucial role in:
- Cultural preservation by promoting heritage sites, traditional festivals, and local crafts.
- Environmental conservation through eco-tourism and protected area management in regions like Sagarmatha, Annapurna, and Langtang.
- Community empowerment, especially through home-stays and rural tourism initiatives that create income opportunities in underdeveloped areas.
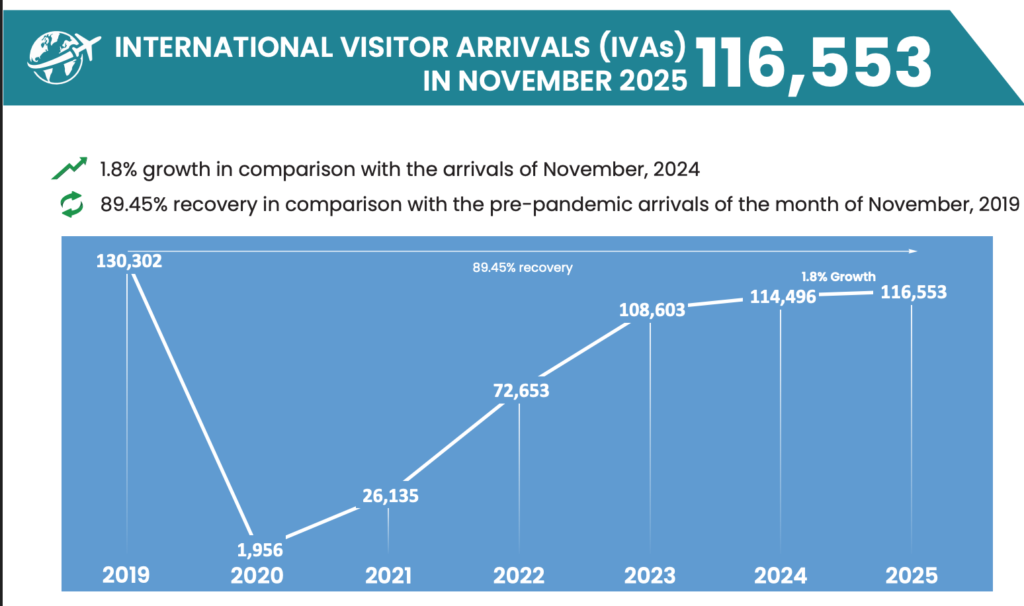
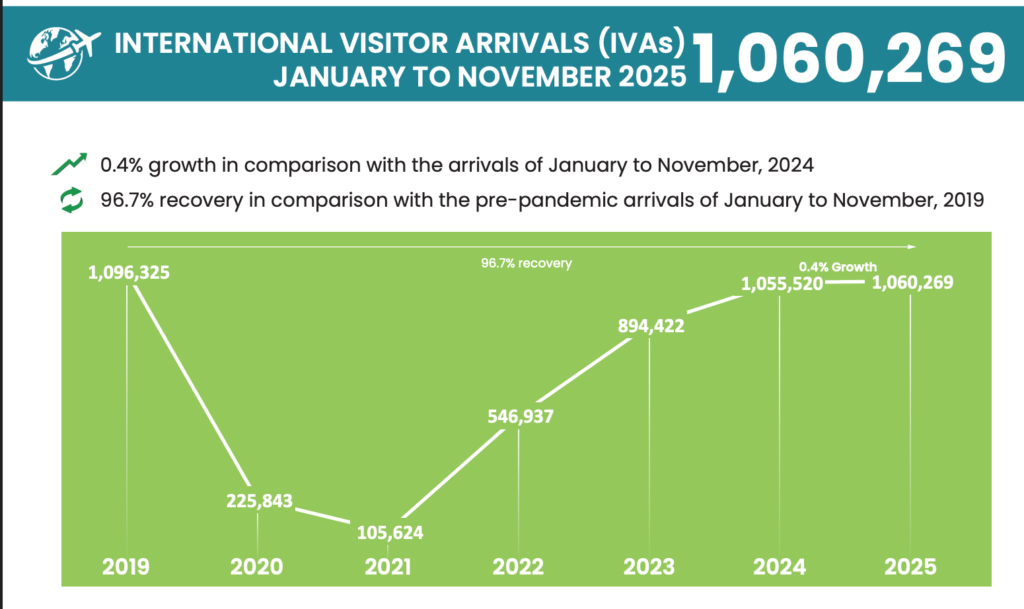
As of October 2025, Nepal has welcomed a total of 943,716 international visitors during the first ten months of the year. This figure represents a 98% recovery compared to pre-pandemic levels in the same period of 2019.
Monthly Tourist Arrivals in 2025 in Nepal
| Month | Number of Tourist Arrivals |
| January | 79,991 |
| February | 96,880 |
| March | 121,687 |
| April | 116,490 |
| May | 86,216 |
| June | 76,425 |
| July | 70,193 |
| August | 88,680 |
| September | 78,711 |
| October | 128,443 |
(Source: Nepal Tourism Board (NTB) via various reports)

Key Insights
- October 2025 saw the highest monthly arrivals so far this year with 128,443 visitors, marking a 3.3% increase over October 2024 and near full recovery to pre-pandemic levels.
- April 2025 recorded the highest number of international visitor arrivals for any April in history, with 116,490 visitors.
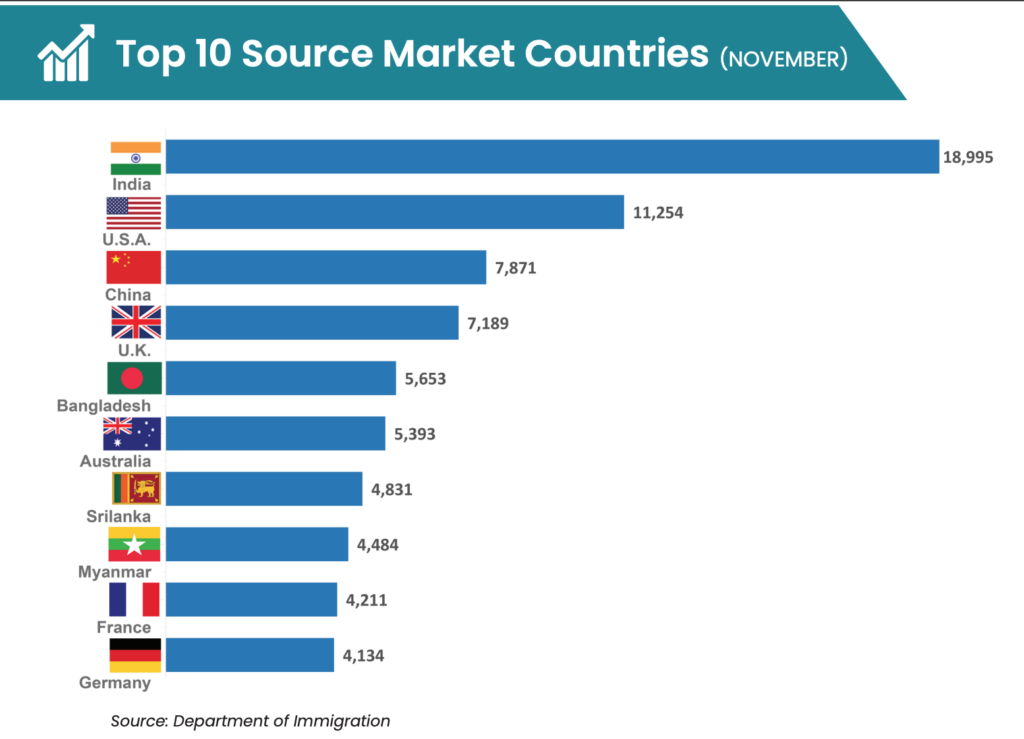
- Top generating markets for October 2025 were India, the USA, the UK, China, and Germany. India remains the largest source of tourists overall.
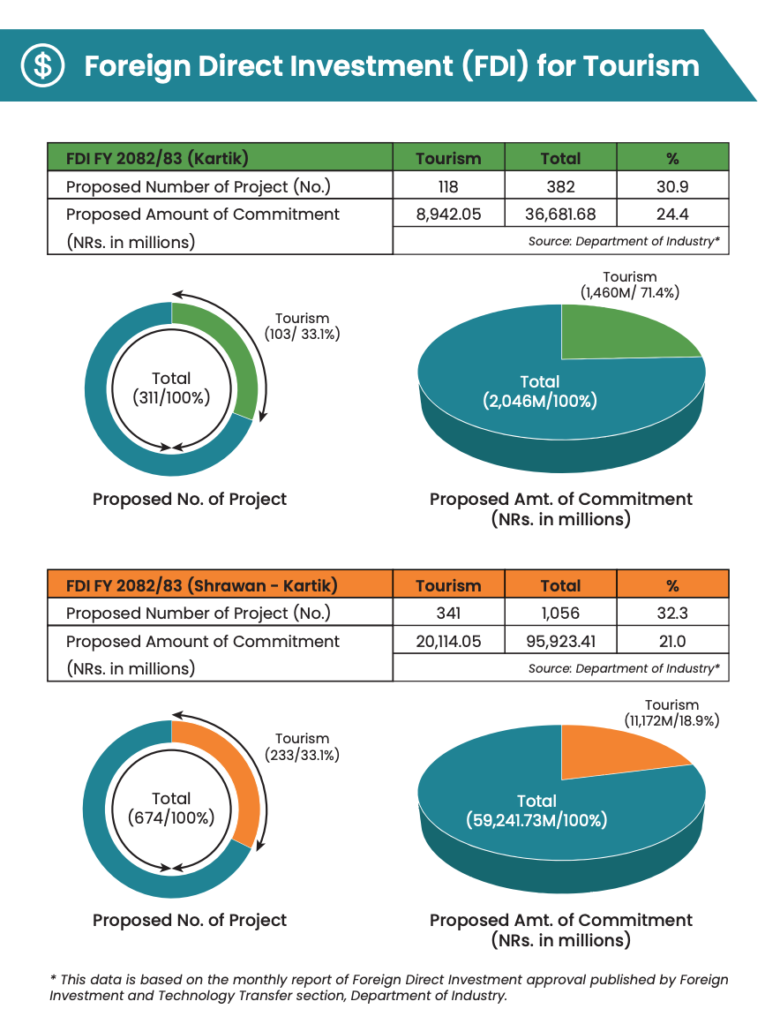
- The tourism sector is a top recipient of Foreign Direct Investment (FDI) pledges in 2025, with commitments across 103 projects related to hotels, adventure tourism, and eco-lodges.
- Authorities are optimistic that Nepal is on track to surpass the one-million-visitor mark again by 2026, signaling a full post-pandemic recovery
| Rank | Country | Arrivals (Jan–Sep 2025) | % share of Jan–Sep total (815,273) |
| 1 | India | 226,052 | 27.7% |
| 2 | U.S.A. | 80,699 | 9.9% |
| 3 | China | 72,174 | 8.9% |
| 4 | Bangladesh | 40,646 | 5.0% |
| 5 | United Kingdom | 38,543 | 4.7% |
| 6 | Australia | 32,807 | 4.0% |
| 7 | Thailand | 20,052 | 2.5% |
| 8 | Germany | 18,475 | 2.3% |
| 9 | Japan | 16,824 | 2.1% |
| 10 | South Korea | 16,731 | 2.1% |
| 11 | Malaysia | 15,054 | 1.8% |
| 12 | Canada | 12,044 | 1.5% |
| 13 | Myanmar | 10,651 | 1.3% |
| 14 | Russia | 9,793 | 1.2% |
| 15 | Spain | 8,552 | 1.0% |


Nepal Tourism at a Glance: Performance Snapshot of 2025
Nepal’s tourism sector continued its steady recovery trajectory in 2025, demonstrating resilience, renewed global confidence, and growing regional demand. With international travel nearly rebounding to pre-pandemic levels, the year marked a significant milestone for the country’s visitor economy.

International Visitor Arrivals: Near Full Recovery
Between January and December 2025, Nepal welcomed 1,158,459 international visitors, reflecting a marginal increase over 2024. More importantly, this figure represents 97% recovery compared to 2019, the benchmark pre-COVID year—signalling that Nepal is firmly back on the global tourism map.
December 2025: A Strong Year-End Finish
Tourism momentum remained strong toward the end of the year. In December 2025 alone, Nepal recorded 98,190 international arrivals, showing a 7% year-on-year growth compared to December 2024. Visitor numbers for the month also achieved 97% recovery against December 2019, reinforcing the sector’s positive outlook.
Key Source Markets Driving Growth
Nepal’s inbound tourism in 2025 was shaped by a mix of neighboring, long-haul, and emerging markets. The top five source countries were:
- India: 292,438 visitors (25.2%)
- United States: 112,316 visitors (9.7%)
- China: 95,480 visitors (8.2%)
- United Kingdom: 58,684 visitors (5.1%)
- Bangladesh: 57,545 visitors (5.0%)
India continued to dominate arrivals, while steady growth from the USA, China, and Europe highlighted Nepal’s diversified market base.
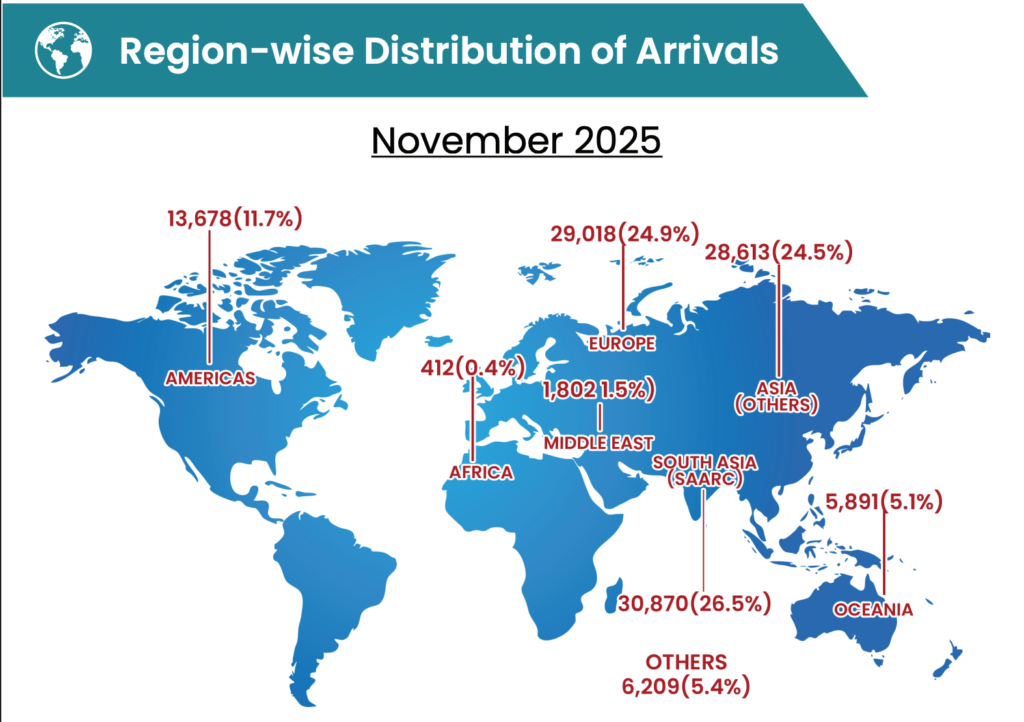
Regional Composition of Visitors
A regional breakdown of arrivals shows Nepal’s strong connectivity within Asia, alongside sustained interest from Western markets:
- South Asia (SAARC): 35.2%
- Other Asian countries: 21.9%
- Europe: 19.1%
- Americas: 11.7%
- Oceania: 4.6%
- Middle East, Africa & others: 7.7%
This balanced distribution reflects Nepal’s appeal as both a short-haul and long-haul destination.

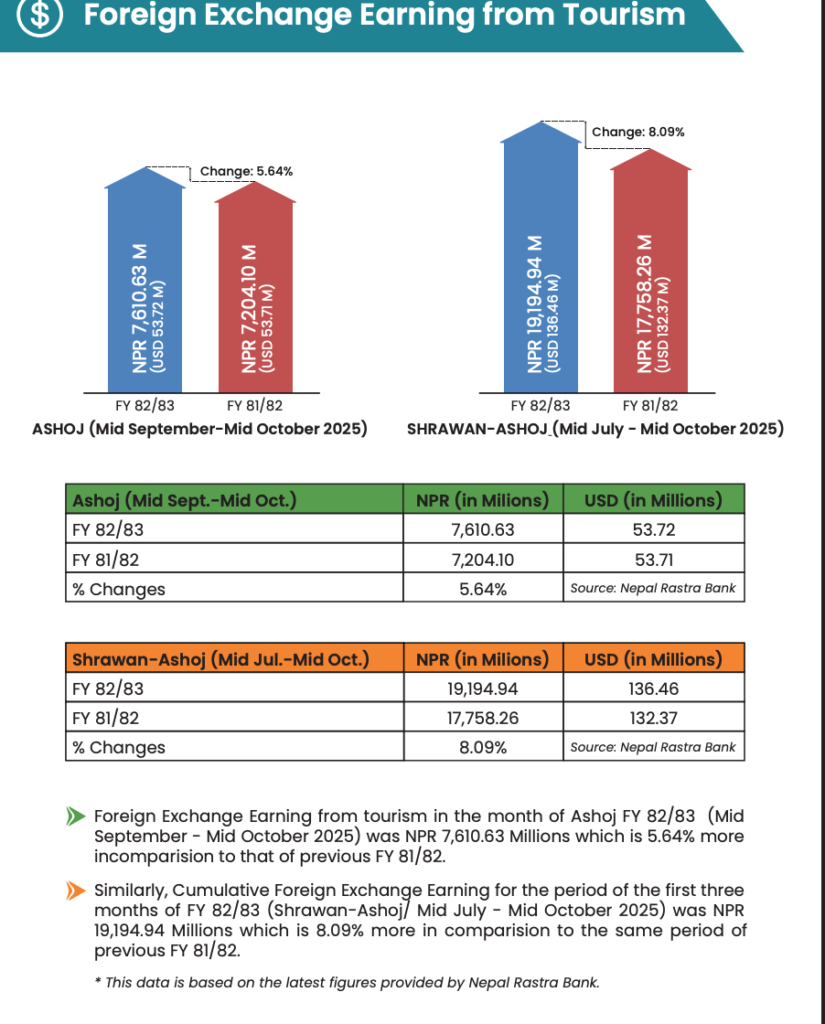
Tourism’s Economic Contribution Gaining Momentum
Beyond arrivals, tourism’s economic indicators also showed encouraging trends. During FY 2082/83, foreign currency earnings from tourism reached NRs. 27,152.55 million between Shrawan and Kartik. Additionally, the sector attracted FDI commitments worth NRs 30,263 million, spanning 476 tourism-related projects from Shrawan to Mangsir—underscoring growing investor confidence.
Looking Ahead
The 2025 figures clearly indicate that Nepal’s tourism industry is not only recovering but gradually repositioning itself for sustainable growth. Strengthening air connectivity, enhancing destination quality, and targeting high-value markets will be critical to converting this recovery into long-term prosperity.
📄 For detailed statistics and official insights, refer to the Tourism Insight Report (December 2025):
http://trade.ntb.gov.np/wp-content/uploads/2026/01/Tourism-Insight-December.pdf
“Tourism Statistics for Nepal (2025)”
“tourism statistics for nepal 2025 pdf”
“nepal tourism statistics 2024”
“nepal tourism statistics 2024 pdf”
“nepal tourism statistics 2023”
“tourism statistics for nepal 2025 pdf download”
“international tourism statistics for nepal 2025”
“nepal tourism statistics 2022”
“nepal tourism statistics 2019”